File:Global Temperature Anomaly.svg

此SVG文件的PNG预览的大小:800×556像素。 其他分辨率:320×222像素 | 640×444像素 | 1,024×711像素 | 1,280×889像素 | 2,560×1,778像素 | 1,440×1,000像素。
原始文件 (SVG文件,名义大小:1,440×1,000像素,文件大小:28 KB)
小结
| 描述 |
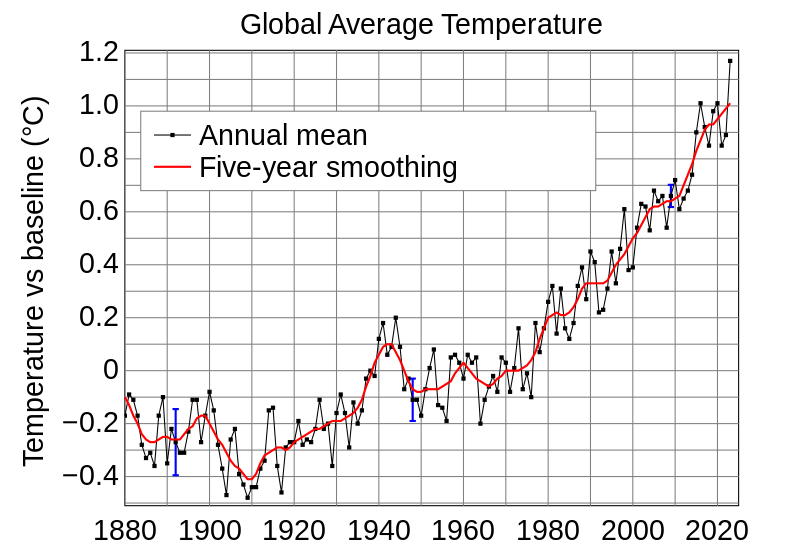
English: Land-ocean temperature index, 1880 to present, with base period 1951-1980. The solid black line is the global annual mean and the solid red line is the five-year lowess smooth. The blue uncertainty bars represents the total (LSAT and SST) annual uncertainty at a 95% confidence interval. [More information on the updated uncertainty model can be found here: Lenssen et al. (2019).]
The following translations are not updated: Čeština: Čárový graf globálního průměrného teplotního indexu Země-oceán, od roku 1880 do současnosti, k základnímu období 1951-1980. Černá čára je roční průměr a červená čára je pětiletý klouzavý průměr. [Toto je aktualizace Obr. 1A v Hansen et al. (2006).] Graf ukazuje celkový dlouhodobý trend oteplování dlouhodobý trend oteplování.
Español: Índice de la temperatura media global, desde 1880 hasta la actualidad, con el período base 1951-1980. La línea negra sólida es la media global anual y la línea roja sólida es una curva suavizada con una regresión local no paramétrica basada en un modelo k vecino más cercano. La función se evalúa utilizando una parte de los datos correspondiente a un rango de diez años de datos, lo que resulta en un suavizado en la práctica de aproximadamente cinco años. Las barras azules representan la incertidumbre (límite de confianza del 95%) para el caso de observaciones espaciales incompletas. Esto se basa en la Fig. 1A en Hansen et al. (2006) y la Fig. 9a en Hansen et al. (2010). Gráfico actualizado con datos hasta 2016 procedentes de https://data.giss.nasa.gov/gistemp/graphs/. El gráfico muestra una tendencia global de calentamiento a largo plazo. |
||
| 日脚 | |||
| 来源 | https://data.giss.nasa.gov/gistemp/graphs_v4/ | ||
| 作者 | NASA Goddard Institute for Space Studies, changed | ||
| 其他版本 |
Derivative works of this file: Globalni teplotni odchylka cs.svg (czech) Derivative works of this file: Temperature Anomaly 1880-now NL.svg (dutch) |
||
| SVG开发 | |||
| 源代码 | SVG code
|
授权协议
| 本文件完全由NASA创作,在美国属于公有领域。根据NASA的版权方针,NASA的材料除非另有声明否则不受版权保护。(参见Template:PD-USGov/zh、NASA版权方针页面或JPL图片使用方针。) | ||
 |
警告:
|
文件历史
揿一个日脚/辰光来望当时出现过个文件。
| 日脚 / 辰光 | 微缩图 | 维度 | 用户 | 备注 | |
|---|---|---|---|---|---|
| 当前 | 2024年1月29号 (一) 07:51 | | 1,440 × 1,000(28 KB) | Habitator terrae | updated // Editing SVG source code using c:User:Rillke/SVGedit.js |
| 2022年9月30号 (五) 14:05 |  | 1,440 × 1,000(28 KB) | আজিজ | File uploaded using svgtranslate tool (https://svgtranslate.toolforge.org/). Added translation for bn. | |
| 2022年1月19号 (三) 20:55 |  | 1,440 × 1,000(25 KB) | Habitator terrae | Update // Editing SVG source code using c:User:Rillke/SVGedit.js | |
| 2021年12月16号 (四) 21:43 |  | 1,400 × 1,000(25 KB) | Turbojet | File uploaded using svgtranslate tool (https://svgtranslate.toolforge.org/). Added translation for ro. | |
| 2021年6月4号 (五) 21:14 |  | 1,400 × 1,000(20 KB) | Sarang | text coding straightened | |
| 2021年1月15号 (五) 02:51 |  | 1,400 × 1,000(39 KB) | Habitator terrae | correct error in error_bar // Editing SVG source code using c:User:Rillke/SVGedit.js | |
| 2021年1月15号 (五) 02:48 |  | 1,400 × 1,000(39 KB) | Habitator terrae | correct errors // Editing SVG source code using c:User:Rillke/SVGedit.js | |
| 2021年1月15号 (五) 02:29 |  | 1,400 × 1,000(39 KB) | Habitator terrae | update according to https://data.giss.nasa.gov/gistemp/graphs_v4/graph_data/Global_Mean_Estimates_based_on_Land_and_Ocean_Data/graph.txt // Editing SVG source code using c:User:Rillke/SVGedit.js | |
| 2020年12月12号 (六) 03:57 |  | 1,400 × 1,000(39 KB) | EnaldoSS | File uploaded using svgtranslate tool (https://svgtranslate.toolforge.org/). Added translation for pt. | |
| 2020年7月15号 (三) 00:44 |  | 1,400 × 1,000(39 KB) | Habitator terrae | Korrektur // Editing SVG source code using c:User:Rillke/SVGedit.js |
文件用法
下向许1张用着箇文件:
全域文件用场
下底个其他wiki使用箇只文件:
- als.wikipedia.org上个用途
- an.wikipedia.org上个用途
- ar.wikipedia.org上个用途
- arz.wikipedia.org上个用途
- as.wikipedia.org上个用途
- be-tarask.wikipedia.org上个用途
- be.wikipedia.org上个用途
- bg.wikipedia.org上个用途
- bh.wikipedia.org上个用途
- bn.wikipedia.org上个用途
- bxr.wikipedia.org上个用途
- ca.wikipedia.org上个用途
- ckb.wikipedia.org上个用途
- cs.wikipedia.org上个用途
- cv.wikipedia.org上个用途
- cy.wikipedia.org上个用途
- da.wikipedia.org上个用途
- de.wikipedia.org上个用途
- Klima
- Kontroverse um die globale Erwärmung
- Klimageschichte
- Energiewende
- Diskussion:Klimawandel/Archiv/1
- Zwei-Grad-Ziel
- Diskussion:Klimaschutz/Archiv
- Divestment (fossile Energien)
- Wikipedia:Grafikwerkstatt/Archiv/2017/Dezember
- Wikipedia:Auskunft/Archiv/2018/Woche 41
- Wikipedia:Hauptseite/Archiv/27. November 2018
- G20-Gipfel in Buenos Aires 2018
- Wikipedia Diskussion:Hauptseite/Artikel des Tages/Archiv/Vorschläge/2019/Q1
- Wikipedia Diskussion:Hauptseite/Artikel des Tages/Archiv/Vorschläge/2019/Q2
- Wikipedia:Hauptseite/Archiv/22. April 2019
- Diskussion:Globale Erwärmung/Archiv/014
- Benutzer:Hungchaka/Klimabewegung
- Zivilisationskollaps
- de.wiktionary.org上个用途
- diq.wikipedia.org上个用途
- el.wikipedia.org上个用途
- en.wikipedia.org上个用途
查看本文件个更多全域用途。